There are many valuable insights hidden within your data. That’s why we provide user-friendly visual analytics to find them. Our data visualisation solutions are designed to support self-service Business Intelligence in a scalable, secure and governable way.
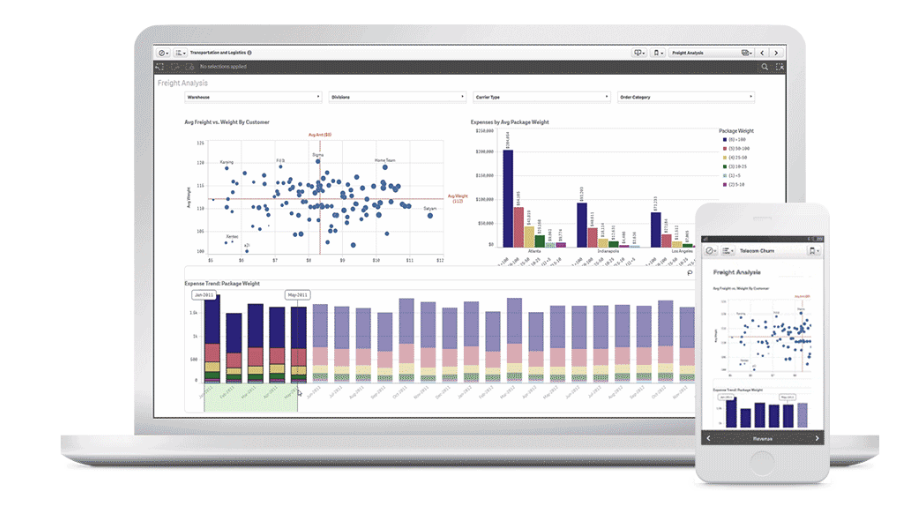
Data visualisation refers to the graphical representation of data and information. Our recommended tools provide the users with the ability to see and comprehend trends, outliers and patterns in your data with ease. The tools we use at Prima Consulting are:
We are able to tailor your data visualisation tools to meet your specific requirements. There are a wide range of benefits to using these Business Intelligence tools to enhance your organisation:
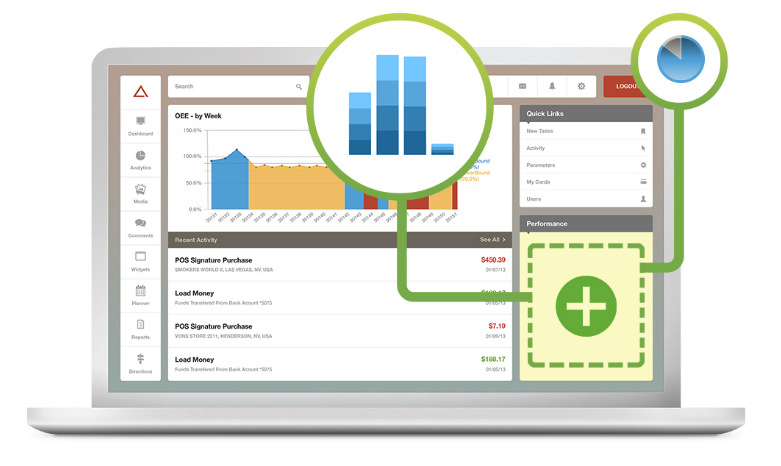
Our data visualisation solutions can be deployed on a single server and scale vertically and horizontally to tackle the accessibility and processing requisites of your solution, whether on-premise or in the cloud.
Embedded visual analytics can range in complexity – from a simple solution like embedding objects in web mash-ups, to far more complex user cases. They include embedding a wide range of analytic capabilities with visualisations directly into applications, such as ERP, CRM or financial management. This helps to provide relevant insights immediately within a business user’s typical working environment.
Interested in understanding how our data visualisation tools will help you succeed?