Working Towards a Target
Enhancing Your Power BI Column Chart with Arrows
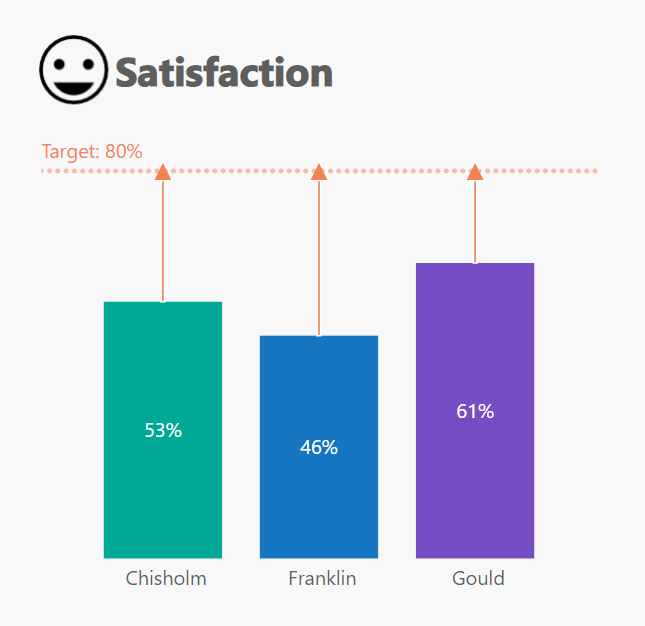
If you want to visually represent progress towards a target in Power BI, adding arrows to your column chart can be a powerful way to illustrate this. Here’s a step-by-step guide on how to use the Error bars feature to achieve this effect.
Ingredients:
- A dataset with customer satisfaction data
- A measure calculating the percentage of customer satisfaction, named [% Satisfaction]
- A dimension field called [Team]
- An icon image for the Satisfaction title
Method:
- Create the title:
- Add a Blank Button visual to the canvas to craft your chart’s title.
- Under Style > Icon, select “Custom” and upload your icon image.
- Set the title text to “Satisfaction”, choose your preferred font and size, set Left Padding to 50px, and align the text to the Left.
- Add a Column Chart
- Insert a Column Chart visual.
- Set the X-axis to [Team] and the Y-axis to [% Satisfaction].
- Format the Column Chart
- In Visual formatting:
- Turn off the Y-axis title and values
- Turn off the X-axis title
- Enable Data labels and set the Position to “Inside center.”
- Adjust the column colors as required.
- In General formatting:
- Turn off the Title
- In Visual formatting:
- Add a Target Constant Line
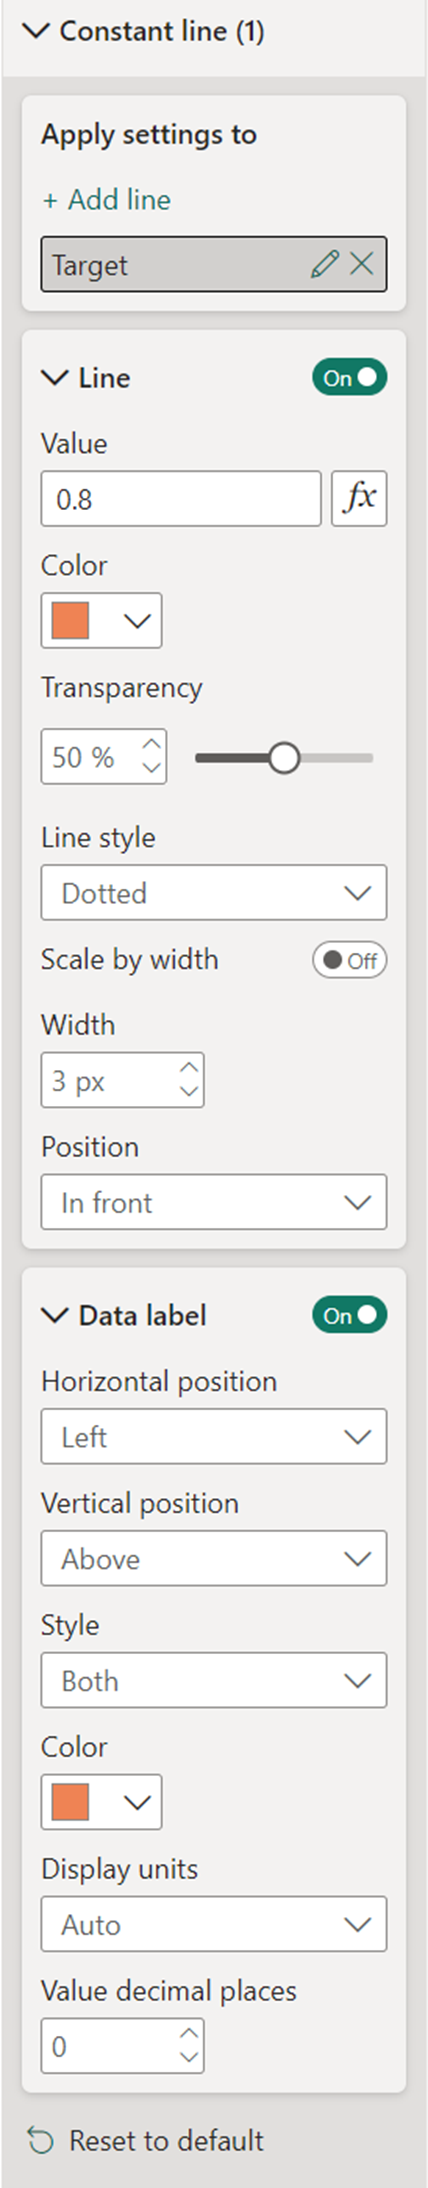
- In the Analytic pane for the visual, add a Constant line with a target value of 80%. (If you are using the new “On-object interaction” feature, add a Reference line and choose the type “Constant line” under Visual formatting instead.)
- Rename the line to “Target”.
- Customize the line by changing its Color and setting the Line style to “Dotted.”
- Turn on the Data label and set the Style to “Both.”
- Change the Color for the Data label to match the line.
- Calculate the Gap
- Create a new measure to calculate the gap between [% Satisfaction] and the target value:
% gap = 0.8 - [% Satisfaction]
- Create a new measure to calculate the gap between [% Satisfaction] and the target value:
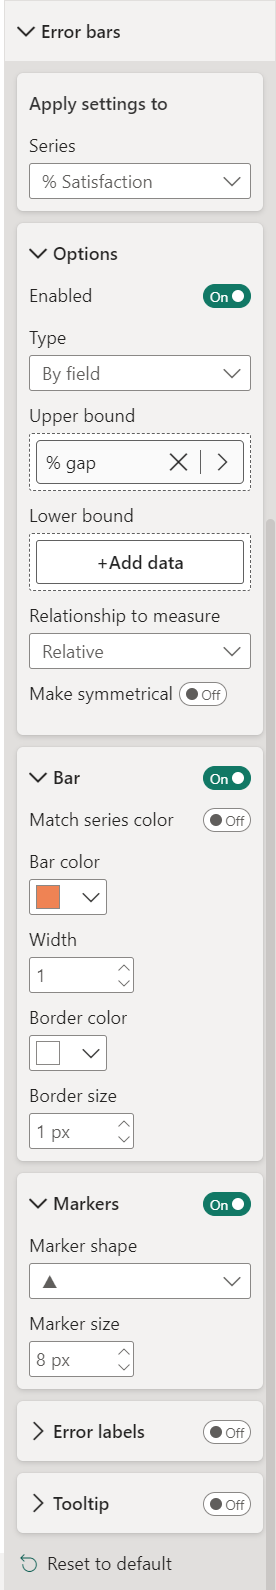
- Add Arrows using Error Bars
- Enable Error bars and keep the Type as “By field”
- Add [% gap] to the Upper bound
- Set the “Relationship to measure” to “Relative”
- Turn on the Bar and adjust the Bar color to your preference
- Enable Markers and set the Marker shape to a triangle. Adjust the Marker size if required.
- Turn off the Tooltip for the Error bar.
- Final Adjustments
- Review your chart and make any final adjustments to ensure clarity and visual appeal.
And there you have it! Your column chart now includes arrows indicating progress towards your target, making it easier for viewers to understand how close they are to achieving their goal.